DPD Update: Improved and Expanded Reporting
- Jason@DPD
- April 28, 2014
- No Comments
This weekend we released an update to our Reports module that adds several new report formats and greatly expands DPD’s sales reporting capabilities. All reports can be exported to CSV for offline manipulation in Excel, your own accounting program, etc.
You can access these reports using the Reports link in the left menu, then selecting which report you would like to view from the list.
In addition to the Purchases and Customer lists that are filterable, we have now added the following table-based reports:
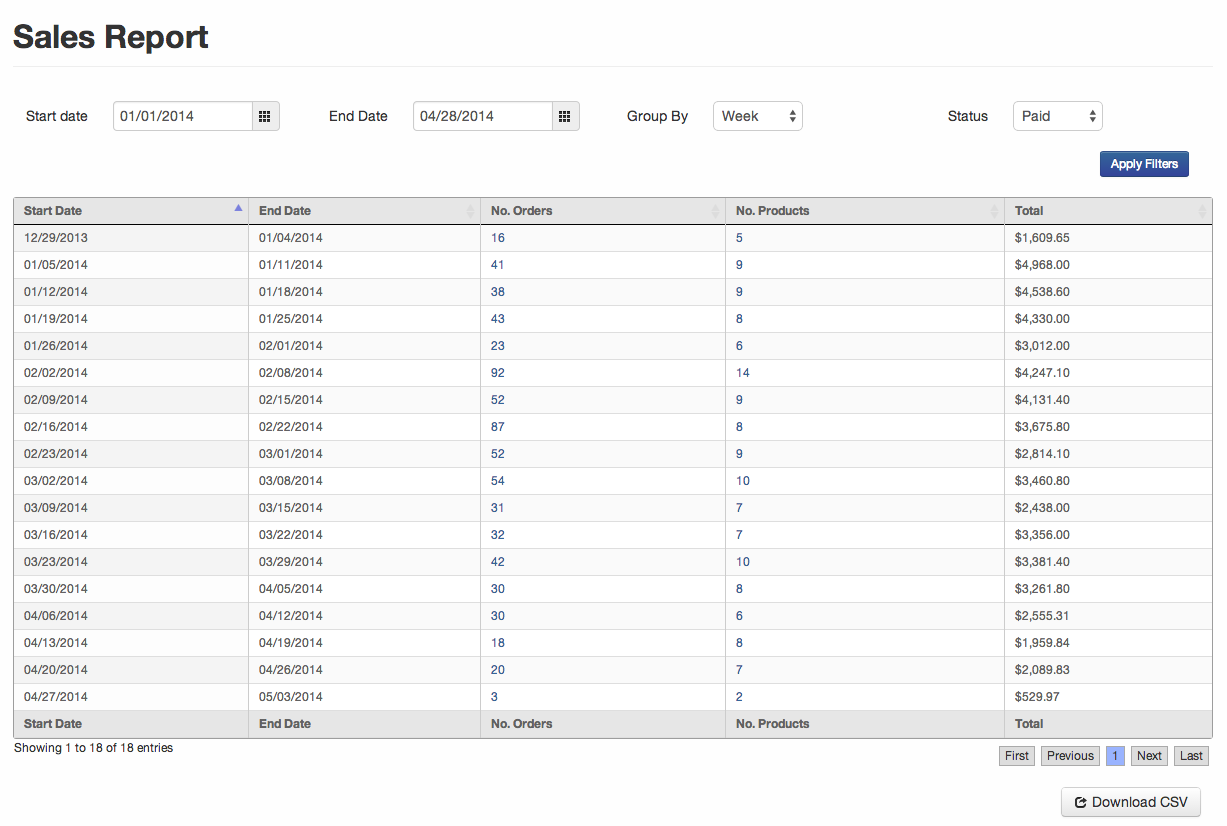
Sales Report
The new sales report lets you generate a table showing your sales between specific date ranges, grouped by date, week, or month. You can also show specific order statuses, so you could generate a refund report, etc.
Using the cross-linked columns you can drill down for each item to view the purchases for the time period or the products that were purchased in that time period using the products purchased report, described below.
Products Purchased Report
You can show all items that were sold within a specific date range with this report. You can also limit it to specific order status such as “only refunded” like the Sales Report.
From the products report you can go directly to the product in question as well as drill down to the purchase list for orders that only contained that product in the given report range.
Coupon Usage Report
The coupon usage report shows your coupon usage in a specific date range (or all time). For each coupon code it will show the number of times used, the total discounts given for the coupon, and the total sales for transactions that used that coupon.
From the coupon usage report you can go directly to the coupon, or view all purchases that used that coupon in the given date range.
Tax Report
To help with sales tax and VAT reporting, the tax report shows all tax monies collected for a given period. The report gives each tax on its own line for a given period. For example, if you collect Sales Tax, GST, and PST tax doing a 30 day lookup will show 3 lines, one for each tax class.
Report Usage
Using the reports together yields powerful results. For example, you can do a Sales Report lookup to find your best week, then click on the products column for that month to move over to the same lookup on the Products Purchased report to see your most popular products. All the reports are designed to work together, letting you drill down to a specific purchase if need be.